Restaurant reporting: top 6 best practices
Whether it’s a restaurant/F&B business or an enterprise operating in other sectors, data-driven decision-making is crucial for growth. This is where restaurant management systems or Restaurant ERPs with robust POS and reporting modules make a significant difference, assisting business owners in collecting and consolidating enterprise data into actionable insights.
To gauge the role restaurant reporting plays in the initiative’s success, we will examine the following in this blog:
- Different types of insights reports, including real-time restaurant analysis reports and restaurant inventory reports, can offer
- Key considerations that can help restaurateurs set up a robust reporting framework (best practices)
Curious? Let’s dive in!
Extracting Insights from Restaurant Management Systems: How Does Restaurant Reporting Drive Success?
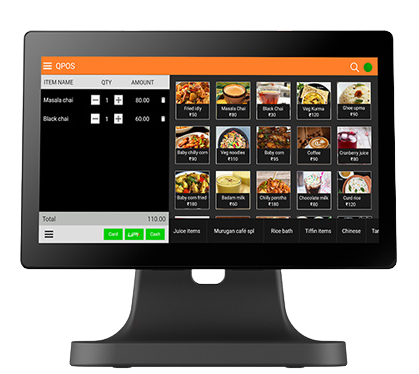
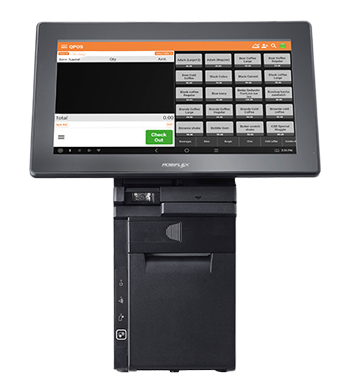
Empowered by a solid restaurant POS machine and the reporting capabilities of the ERP software, decision-makers of an F&B business can:
- Track sales and profitability of the restaurant to plan growth accordingly
- Discover strengths and areas of improvement in the menu and restaurant management
- Identify food trends as well as dish-wise customer preferences so that the staff can recommend dishes that pair well with each other, or the manager can create attractive combos
- Refine the procurement process as per food trends
- Keep tabs on inventory levels, making replenishment easier and more accurate, thereby minimising overstocking or stockouts and the loss they cause (To discover how inventory is tracked accurately in real-time with the help of POS scales and restaurant POS machines, read our blog: 5 Ways to Improve Inventory Accuracy with QPOS – The Restaurant & Food Outlet Edition )
- Conduct stock and sales audits effortlessly
- Calculate the ROI of the marketing efforts, such as offers, promotions, and loyalty programs, against sales (Determining the ROI in turn assists decision-makers in performing gap analysis for boosting sales if the ROI is not promising)
- Enjoy simplified payroll management, analyse ROI of workforce expenditure, and monitor staff performance to recognise if workforce expansion or layoffs are needed, while also ensuring that the employees are neither overworked nor unproductive
We have one of the best tools for generating real-time restaurant analysis reports for you.
Additional Insights: Advantages of Reports Generated by Restaurant Management Systems in Franchise Management
Apart from the pointers above, which apply to single-outlet F&B players and franchises, the reporting capabilities of restaurant ERPs can address these challenges that franchisors face by:
- Tabulating the overall profitability of the business, along with the performance of each outlet in the franchise
- Facilitating the comparison of the performance of different outlets to identify weaknesses in the laggard outlets
- Calculating the due royalty for the franchisor while reconciling payments made by franchisees, thereby indicating discrepancies, if any
Those further intrigued by franchise management can browse through our blog: Why Do You Need a POS System for Multiple Locations?
Top 6 Best Practices for Restaurant Reporting: Does Your Restaurant Management System Enable Them?
Some of the key considerations while configuring the reporting module of the ERP and other reporting best practices:
- Opting for a Restaurant-Specific ERP
While the market has several run-of-the-mill ERP software platforms, using one tailored to the restaurant business is likely to save restaurant owners a lot of trouble. This is because generic ERP solutions require end-to-end customisation, leaving the restaurateurs to plan every module and its features, while they may not have the exposure or the foresight to configure the modules as per all the scenarios where the software is needed. Such a degree of customisation might be time-consuming when deploying, and if the configuration is not future-proofed from the get-go and repeated service requests are needed, the implementation can prove expensive in the long run. Already, several venture owners may find that even the basic customisation costs for tailoring the ERP for the needs of F&B outlets are exorbitant.
On the other hand, when restaurant-specific ERPs are combined with restaurant POS machines and other hardware made for the F&B sector, the business can hit the ground running by leveraging the platform’s ready-made modules, usually designed and refined after extensive market research. Should the business need any brand-specific modifications, most platforms are likely to accommodate such requests.
It is worth noting that the choice of the ERP does not impact reporting quality alone, but other tasks in the workflow as well; this decision is the first and one of the most important steps for ensuring restaurant reporting best practices are followed.
- Designing Reports Based on Frequently-Used Parameters
This step ensures that the most important metrics, depending on the business model, are automatically included in monthly, quarterly, and yearly reports as well as on-demand comprehensive reports.
To elaborate, a franchise owner may want to not only track sales per outlet but also the best and the worst-performing outlets highlighted in the report. On the other hand, identifying the best-performing dish and its ROI may be the priority of a food truck starting its journey. Needless to say, offering an automated snapshot and analysis of the metrics in question, these reports help fast-track actions without any laborious number-crunching.
Opting for separate specialised reports, including restaurant inventory reports and real-time restaurant analysis reports, can further make decision-making quicker.
- Diverse Options for Visualisation:
When creating reports, data visualisation and effective tabulation of key data points are vital for identifying opportunities and areas of improvement because interpreting raw data is usually challenging, particularly if the data volume is large. Data visualisation formats include various types of charts and graphs; the appropriate format depends on the data type and the context. Representing data in an attractive and digestible manner is especially useful during meetings with employees, investors, and board members because not every individual is data-savvy.
In other words, the availability of different data visualisation formats in a restaurant management system is a must for any business where transparent communication is as important as quick decisions.
Visualise and crunch massive enterprise data sets captured via restaurant POS machines, effortlessly.
- Frequency of Data Crunching
A common restaurant reporting best practice amongst successful F&B outlets is analysing the business data at a fixed interval, which is not too small to pinpoint any significant change or trends, or too big to narrow down the necessary insights for an immediate, implementable action.
Let’s consider these two use cases of the reporting module:
- Use Case 1: Regular restaurant inventory reports can offer clarity on spoilage, inventory utilisation, ROI of inventory (probably, the most important metric for arriving at the profit margin), and rate of utilisation of ingredients, amongst other metrics.
- Use Case 2: Real-time restaurant analysis reports are great for generating instant snapshots of business resources. This type of report is needed during tasks such as generating the procurement order.
These two examples illustrate the importance of the data analysis frequency: the first use case demonstrates the need for a sufficiently big interval to predict trends, while the latter shows the role real-time reports play. Therefore, before selecting the restaurant management system, it is important to note how flexible the reporting module is in accommodating data sets corresponding to various intervals.
- Historical Data Analysis
From time to time, analysing patterns in historical data, rather than studying data over a fixed interval, can help the decision-maker recognise trends. With trends identified, the business can optimise its resources and decisions to make the best of the situation.
6. Control Over the Accessibility of Reports
Given that the restaurant reports may contain insider information, restricting access to the data analysis is a must. This measure can be enabled by the user management module of the restaurant ERP.
At the same time, the authorised stakeholders may need to remotely access the reports. Here, a cloud-based restaurant management system can save the day. The cloud-native environment also comes equipped with built-in analytics tools, which can customise reports as needed.
Looking for an efficient restaurant ERP with excellent report-generation capability? Our comprehensive restaurant management platform, QPOS, may be just the solution you need. In the next section of the blog, let’s learn more about QPOS.
Leveraging QPOS for Meticulous Restaurant Reporting
The report-making module of QPOS supports F&B businesses in making data-driven strategic decisions such as menu engineering, inventory planning and optimisation, and profit analysis, via tailored real-time reports or those generated at a regular interval.
This module of our restaurant ERP enables sales and trends analysis and effortless identification of key insights via interactive and easy-to-understand dashboards. Our cloud-based platform also empowers businesses to:
- Access reports remotely
- Perform demand forecasting based on historical data
- Ensure user-based report access
- Indicate royalty reconciliation on respective reports
Further, QPOS has robust AI capabilities with an NLP (Natural Language Processing) chatbot, which facilitates report customisation while fetching specific data points, including real-time information.
Want to know more about our restaurant management capabilities and the quality of our platform’s reporting?
Contact us today!